A team led by Professor Zhen Yuan from Centre for Cognitive and Brain Sciences (CCBS) at the University of Macau UM) has made new progress in mapping self-awareness (SA) brain networks. This is a multi-center clinical study conducted across CCBS and multiple brain imaging centers in Mainland China, aiming to assess the ability to tune in to individual’s own feelings, thoughts, and actions. The research results were published by the internationally renowned journal Neuroimage (5 year IF=6.1).

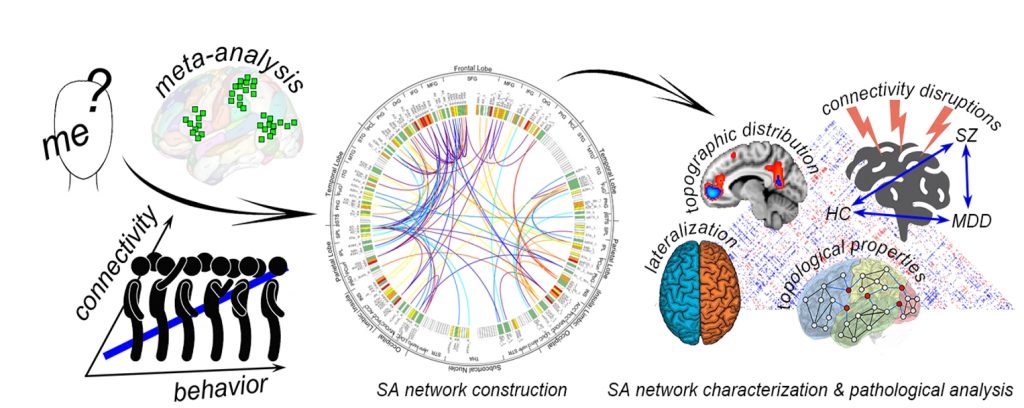
Figure 1. Schematic of this study.
SA refers to the conscious awareness of one’s internal thoughts and interactions with others, relying on specific brain networks that remain incompletely understood. While numerous SA-related regions have been identified, the connections between these regions remain underexplored, leaving the organizational principles and complete network architecture of SA unclear. Interestingly, SA represents a temporally stable personality trait in healthy adults, yet individuals vary significantly in their SA levels. This difference reflects one’s capacity to integrate internal states, observable behaviors, others’ evaluations, and their interactions with social roles and environments. Such variability can be quantifiable using psychometric tools, such as the Revised version of Self-Consciousness Scale (SCS-R). This work integrated meta-analytic findings with connectivity-behavior correlation analyses, where behavior data was quantified by SCS-R scores, to systematically identify SA-related brain regions and connections in healthy adults (Fig. 1, left panel).
In addition, Prof. Yuan’s team has successfully identified reliable brain regions and accurate connections associated with SA across the whole brain. By constructing weighted structural connectivity networks for SA, as well as for its two aspects including public and private self, they quantified the involvement of inter-regional connections in functional expression of SA through edge weights. They also systematically characterized the morphological features, topological properties, and abnormalities of these networks and connections in schizophrenia (SZ) and major depressive disorder (MDD). Their findings significantly advanced our understanding of SA’s neurobiological substrates and their pathological deviations.
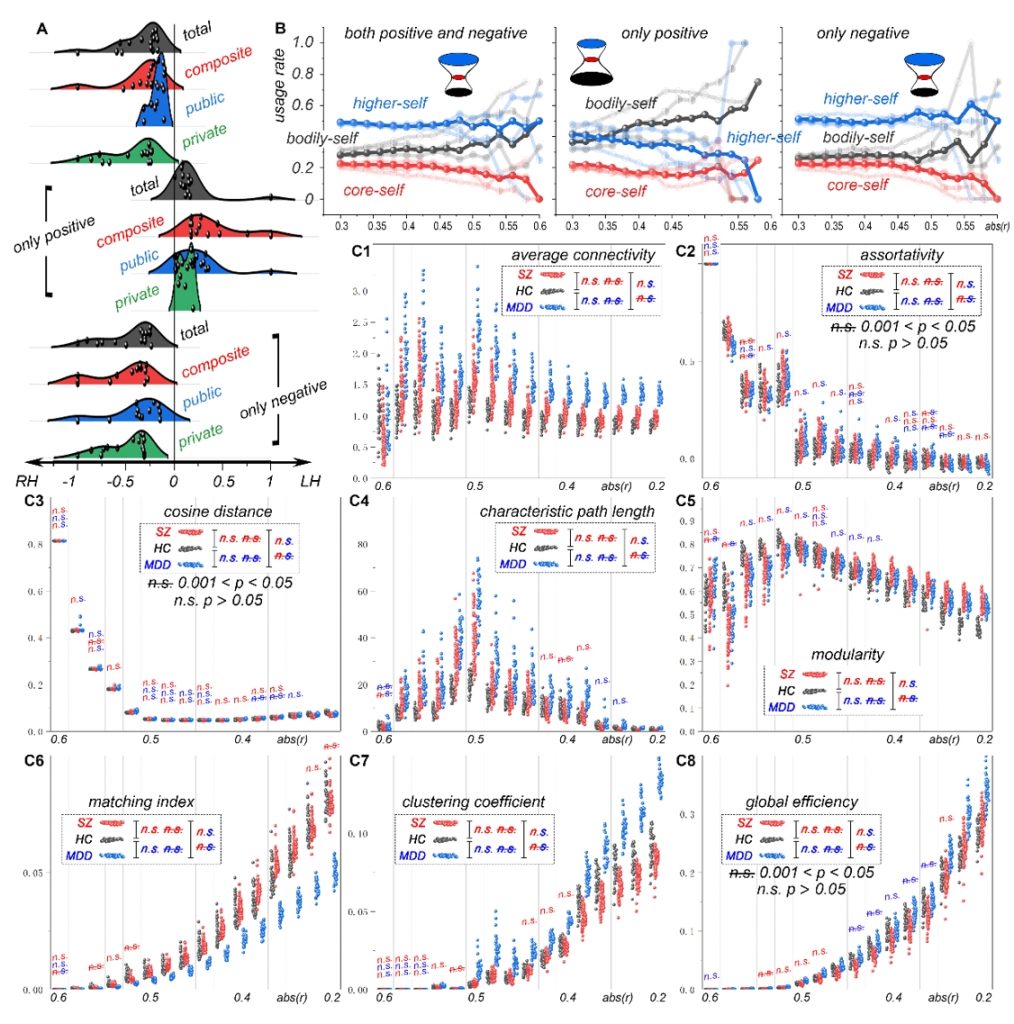
Further, they used robust full-threshold analyses to comprehensively characterize these SA networks. They revealed distinct brain lateralization trends in public, private, composite SA networks. These horizontally divided SA networks were then mapped onto a vertically defined three-layer model of SA: bodily-, core-, and higher-self. This mapping identified distinct hourglass-like spatial architectures. Besides, pathological analysis demonstrated that approximately 40% of SA connectivity was altered in SZ, and 20% in MDD, with 90% of MDD alterations overlapping with SZ. While disease-specific and shared alterations were observed in network-level topological properties, the core SA connectivity framework remained preserved in both disorders (Fig. 1, right panel).

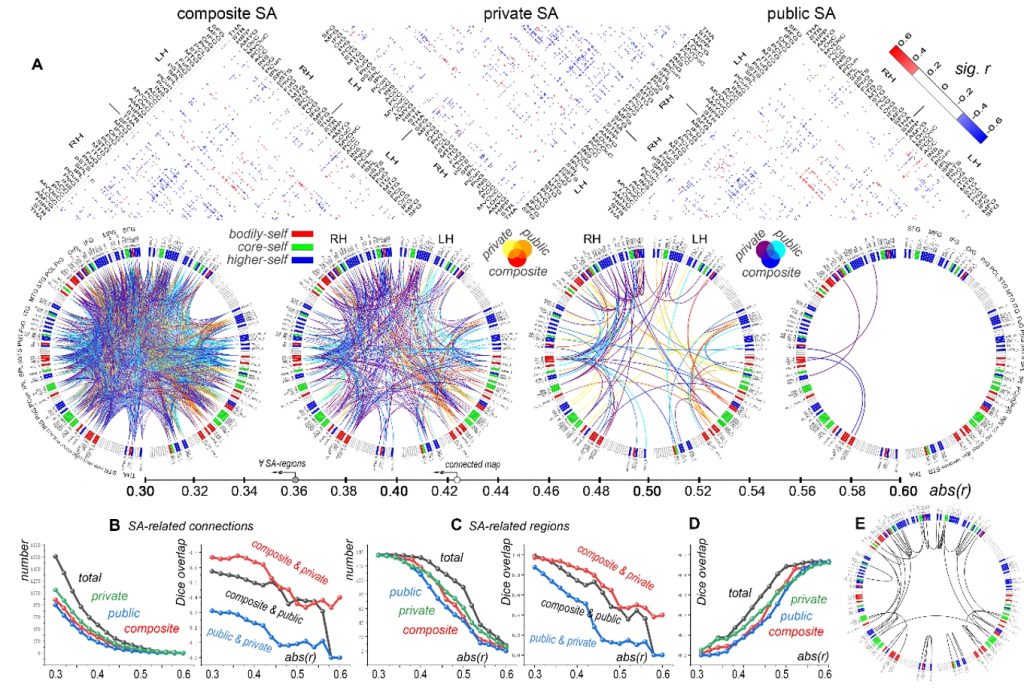
Figure 2. SA-relatedness networks. (A) Relatedness matrices for public, private, and composite SA. Pixel represents significant positive (red) or negative (blue) r between SA levels and connectivities, with non-significant connections left blank. Sixteen SA networks were extracted at |r| values ranging from 0.3 and 0.6. Circle diagrams for |r| at 0.3, 0.4, 0.5, and 0.6 were shown, highlighting regions according to the three-layer SA model: bodily-self (red bar), core-self (green), and higher-self (blue). Connection curves were color-coded. abs(r): |r|. (B) Number of connections related to composite, public, and private SA levels and their total (left panel), and their Dice overlaps (right panel). (C) Number of identified endpoints (left panel), and their Dice overlaps (right panel). (D) Overlaps between regions identified by both methods. (E) Connections with no significant individual connectivity differences but potentially relevant to SA.

Figure 3. SA network characterizations. (A) Lateralization of SA networks. Kernel smooth curves were utilized to illustrate the lateralized distribution of composite (red), public (blue), private (green) SA networks and their total (black). (B) Distribution of SA networks. The usage rates of bodily-self, core-self, and higher-self regions by SA connections were showed by black, red, and blue lines, respectively. (C) Topological properties. The average connectivity, assortativity, cosine distance, characteristic path length, modularity, matching index, clustering coefficient, and global efficiency were showed in C1-C8. HC, SZ, and MDD individuals were represented by black, red, and blue dots, respectively. ‘n.s.’ indicated non-significant (p > 0.05) or small effect size (r < 0.3 or Cohen’s d < 0.5) group differences, while significant group differences with p < 0.001 and medium or larger effect sizes were denoted by ‘ ‘. ‘n.s.‘ denoted significant group differences with p between 0.001 and 0.05.
The research was led by Prof. Yuan and his postdoc fellow Dr. Xiaoluan Xia is the key member of this project. This work received joint support from multiple funding sources including RSKTO with University of Macau (MYRG-GRG2024-00259-FHS, MYRG2022-00054-FHS, and MYRG-GRG2023-00038-FHS-UMDF), and Macau Science and Technology Development Fund (FDCT 0014/2024/RIB1) .
Research Articles Browsable: https://www.sciencedirect.com/science/article/pii/S1053811925002083
Xia X, Gao F, Xu S, Li K, Zhu Q, He Y, Zeng X, Hua L, Huang S, Yuan Z. 2025. The Self-Awareness Brain Network: Construction, Characterization, and Alterations in Schizophrenia and Major Depressive Disorder. NeuroImage.


